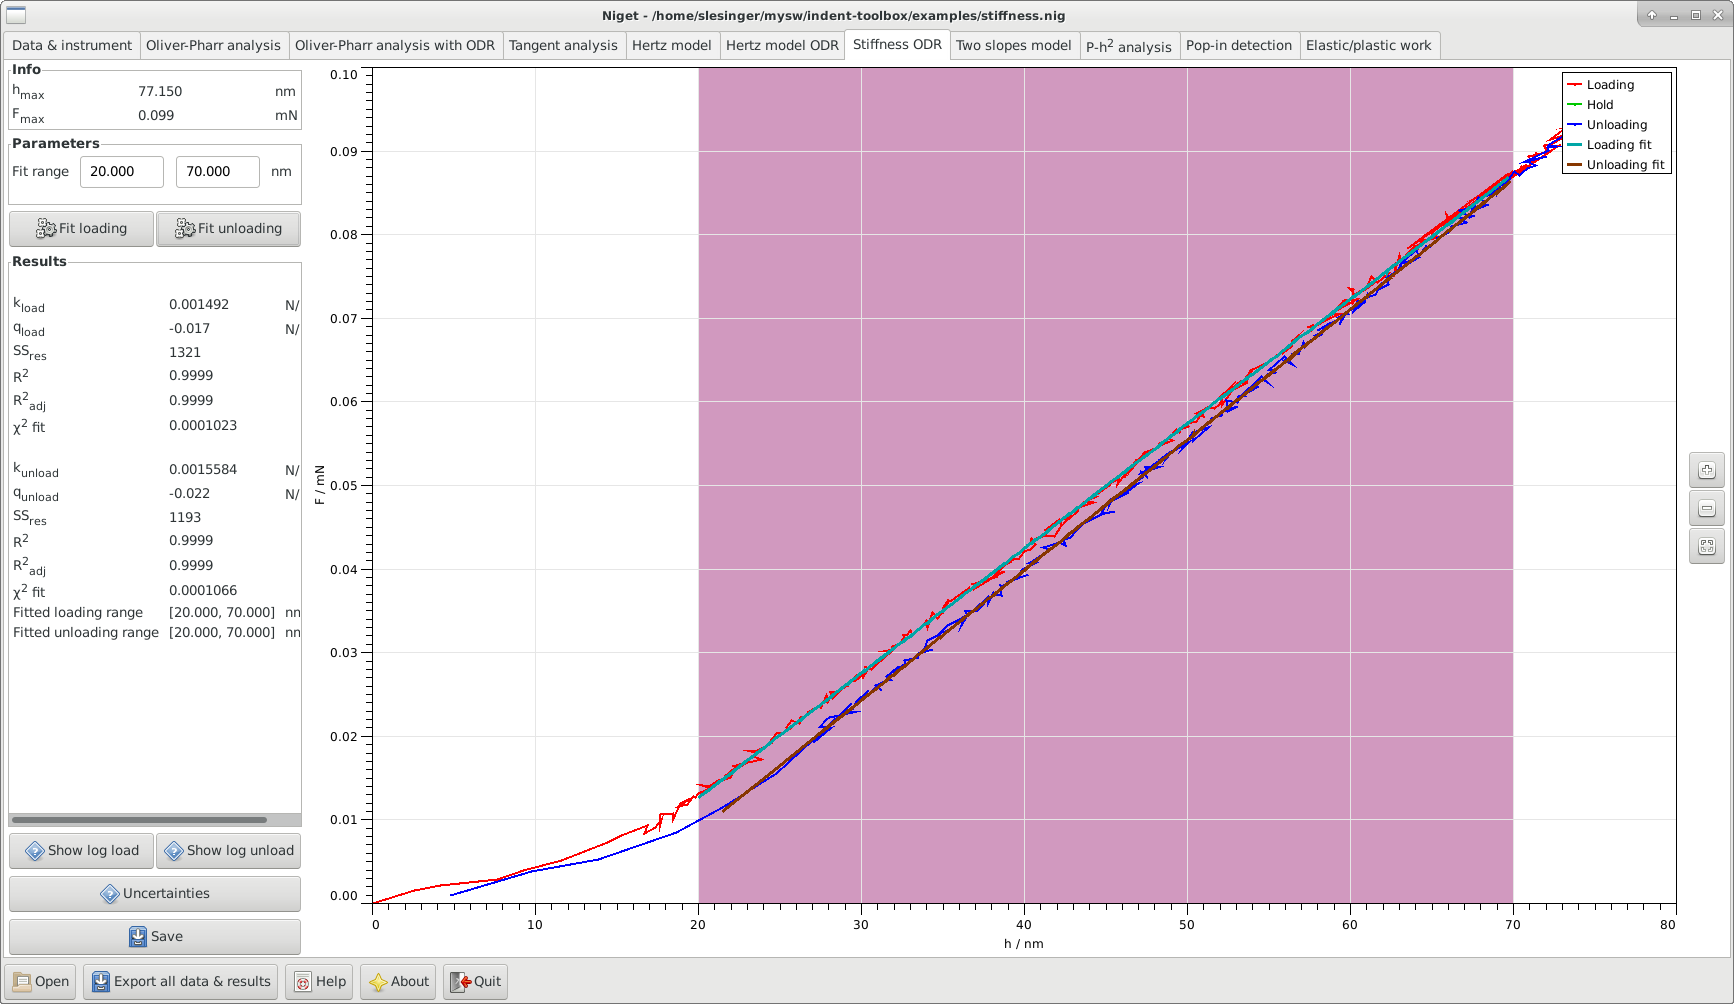
10 Stiffness method
This module allows the determination of the stiffness of an object by fitting both loading and unloading curve with a straight line.
This method is shown unless the software was compiled without Fortran support.
10.1 Window
The window consists of several blocks:
-
•
Info displays the maximum depth and force during the indentation
-
•
Parameters shows the selected range in nm and in % of the maximum force, and the correction
 .
.-
-
The fitting range can be selected either using the mouse or typing in the range entries.
-
-
-
•
Fit buttons for indepedent fitting of the loading and unloading curves, see section 10.2 for details of the calculation.
-
•
Results displays all results in the following order: the slope of the loading curve
 , the offset of the loading curve
  ,
the residual sum of squares of the corresponding fit and the goodness of fit parameters,
the slope of the unloading curve
,
the residual sum of squares of the corresponding fit and the goodness of fit parameters,
the slope of the unloading curve  , the offset of the loading curve
  ,
the residual sum of squares of the corresponding fit and the goodness of fit parameters
and the ranges used for the fitting procedures.
Warnings are displayed if the fittings procedures failed.
,
the residual sum of squares of the corresponding fit and the goodness of fit parameters
and the ranges used for the fitting procedures.
Warnings are displayed if the fittings procedures failed. -
•
Uncertainties show the uncertainty analysis window, see section 15.2.3.
-
•
Show log load Show the report about the fitting procedure of the loading curve in a separate window. The reports are saved to files fit.log.stiff.load.err and fit.log.stiff.load.rpt.
-
•
Show log unload Show the report about the fitting procedure of the unloading curve in a separate window. The reports are saved to files fit.log.stiff.unload.err and
fit.log.stiff.unload.rpt. -
•
Save save parameters and results to given file.
-
•
Graph display the unloading curve and the fitted curves. Stepwise zooming/unzooming can be performed by selecting a range with the mouse and pressing the Zoom/ Unzoom buttons. The graph is restored to its original size by the Restore button.
10.2 Procedure
The stiffness analysis simply fits both loading and unloading curve with straight lines.
![[LOGO]](data:image/png;base64,iVBORw0KGgoAAAANSUhEUgAAAAsAAAAOCAYAAAD5YeaVAAAAAXNSR0IArs4c6QAAAAZiS0dEAP8A/wD/oL2nkwAAAAlwSFlzAAALEwAACxMBAJqcGAAAAAd0SU1FB9wKExQZLWTEaOUAAAAddEVYdENvbW1lbnQAQ3JlYXRlZCB3aXRoIFRoZSBHSU1Q72QlbgAAAdpJREFUKM9tkL+L2nAARz9fPZNCKFapUn8kyI0e4iRHSR1Kb8ng0lJw6FYHFwv2LwhOpcWxTjeUunYqOmqd6hEoRDhtDWdA8ApRYsSUCDHNt5ul13vz4w0vWCgUnnEc975arX6ORqN3VqtVZbfbTQC4uEHANM3jSqXymFI6yWazP2KxWAXAL9zCUa1Wy2tXVxheKA9YNoR8Pt+aTqe4FVVVvz05O6MBhqUIBGk8Hn8HAOVy+T+XLJfLS4ZhTiRJgqIoVBRFIoric47jPnmeB1mW/9rr9ZpSSn3Lsmir1fJZlqWlUonKsvwWwD8ymc/nXwVBeLjf7xEKhdBut9Hr9WgmkyGEkJwsy5eHG5vN5g0AKIoCAEgkEkin0wQAfN9/cXPdheu6P33fBwB4ngcAcByHJpPJl+fn54mD3Gg0NrquXxeLRQAAwzAYj8cwTZPwPH9/sVg8PXweDAauqqr2cDjEer1GJBLBZDJBs9mE4zjwfZ85lAGg2+06hmGgXq+j3+/DsixYlgVN03a9Xu8jgCNCyIegIAgx13Vfd7vdu+FweG8YRkjXdWy329+dTgeSJD3ieZ7RNO0VAXAPwDEAO5VKndi2fWrb9jWl9Esul6PZbDY9Go1OZ7PZ9z/lyuD3OozU2wAAAABJRU5ErkJggg==)