Visualisation
To visualize the results (intensity sums, angular scans) we can use any graph plotting software, on Linux it is e.g. gnuplot. To visualize the VTK files we recommend Paraview.
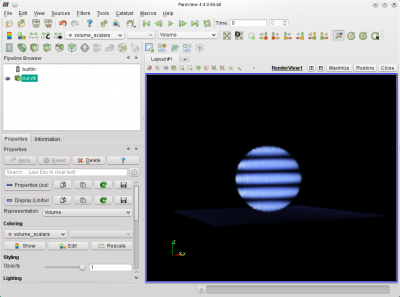
An example of Paraview use for VTK files visualisation was shown already in getting started section:
